```{r}
library(sysfonts)
font_add_google("Bungee Tint", db_cache = FALSE)
```Three Tips for Better Quarto Plots
R
Simple methods for higher-quality figures
If you regularly create Quarto documents, it s important to ensure that you can incorporate quality figures without spending a long time messing about. These are some of my favourite settings to ensure that my figures look great every time I render a Quarto document.
Use showtext through Knitr
Showtext offers better text rendering, as well as great control over settings such as DPI, which controls text size. Setting up showtext in your Quarto YAML metadata is much easier the calling showtext_begin() and showtext_end() every time you want to produce a plot!
---
knitr:
  opts_chunk:
    fig-showtext: true
---
Use Google Fonts with sysfonts
Simply calling font_add_google() with your chosen Google Font will make that font available in your R session and will look excellent in your showtext-enabled plots. Using Google Fonts has the added benefit of make your code much more portable.
Let’s load something a bit wacky:
You may need to specify db_cache = FALSE for some fonts that have not been cached in your sysfonts install.
Set dev options in Knitr chunks
You can set dev arguments in your chunks, again avoiding the (in my opinion) rather clunky dev functions. I typically use this to set a transparent background, but that’s a pretty poor example on a white page. Let’s set a solid background and see how a plot looks with our custom settings!
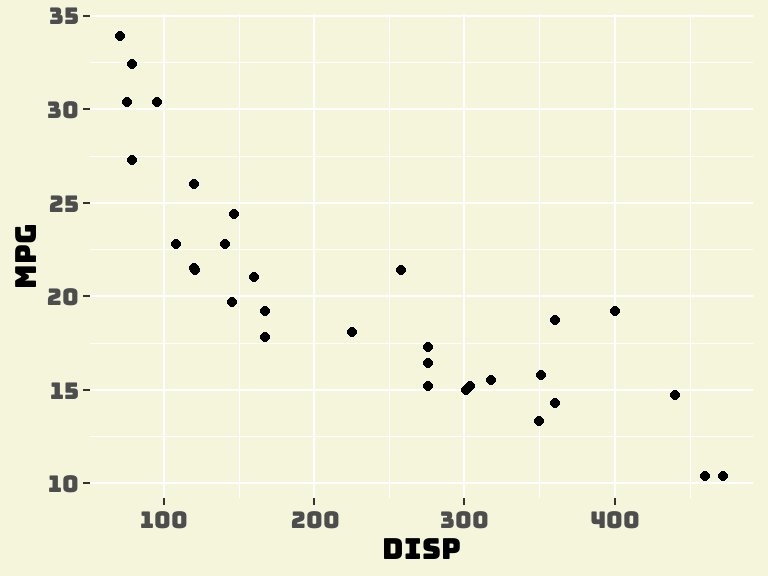
```{r}
#| dev.args: !expr list(bg="beige")
#| fig-cap: "An example figure"

library(ggplot2)
data("mtcars")

mtcars |>
  ggplot(aes(x = disp,
             y = mpg)) +
  geom_point() +
  theme(text = element_text(family = "Bungee Tint"),
        panel.background = element_blank(),
        plot.background = element_blank())
```